- Middlesex
- Grey County
- Hastings
- Frontenac
- Oxford
- Muskoka
- Bruce
- Peterborough
- Northumberland
- Elgin
- Kawartha Lakes
- Parry Sound
- Leeds and Grenvi
- Norfolk
- Huron
- Lambton
- Renfrew
- Stormont, Dund
- Perth
- Lennox & Addin
- Prescott and R
- Nipissing
- Brantford
- Lanark
- Prince Edward
- Haliburton
- Cochrane
- Essex
- Haldimand
- Brant
- Chatham-Kent
- Timiskaming
- Sudbury
- Algoma
- Leeds & Grenvi
- Greater Sudbur
- Thunder Bay
- Manitoulin
- Rainy River
- Kenora
- Haldimand-Norfolk
- New Homes
- For Sale
- For Rent
Tapicon to shortlist and see them here, Then you’ll be able to comparethem too

Maximum 4 project can be compared at one go.

Neighborhood Overview
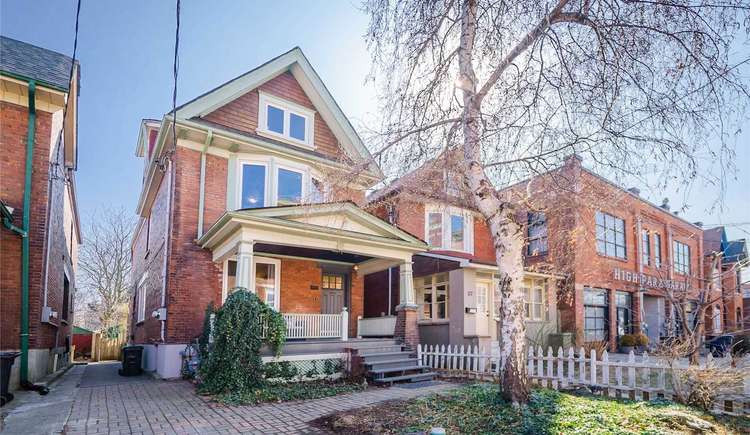
Roncesvalles, Toronto
- Sale : $1.85M - $22.50M
- Rent : $4K - $10K
Roncesvalles Neighbourhood Overview
Buildings in Roncesvalles
Liveability & Lifestyle of Roncesvalles
| Liveability | 81 |
|---|---|
| Amenities | A+ |
| Cost of Living | F |
| Employment | C- |
| Housing | C |
| Schools | A+ |
| Index | Roncesvalles (/100k people) | Toronto (/100k People | Ontario (/100k people) | National (/100k people) |
|---|---|---|---|---|
| Total Crime | 2,373 | 2915 | 3,086 | 4,223 |
| Violent Crime | 609 (estimate) | 748 | 792 | 1,042 |
| Property Crime | 1,764 (estimate) | 2167 | 2,294 | 3,181 |
People & Culture of Roncesvalles
| Median Income | $100,417 |
|---|---|
| Unemployment Rate | 3.4% |
| Labour participation rate | 80.0% |
| Speak English only | 76.6% |
|---|---|
| Speak French only | 0.1% |
Neighbourhood Nearby Roncesvalles
Schools
- St. Vincent de Paul Catholic School
- Fern Avenue Junior and Senior Public School
- Garden Avenue Junior Public School
- Howard Junior Public School
Restaurants
- Samaira's Kitchen
- Panago Pizza
- The Ace
- Barque Smokehouse
Shopping Centres
- Toronto Premium Outlets
- Loblaws Plaza
- Dufferin Mall
- Yorkdale Shopping Centre
Healthcare Centres
- Judy Dan Research & Treatment Centre
- Evercare Medical Centre - Walk In Clinic
- St Joseph's Toronto Urban Family Health Team
- HealthCare Plus Parkdale
Top Attractions & Places to Visit in Roncesvalles
Roncesvalles Village
An urban neighbourhood called Roncesvalles Village has a distinct village feel that is particularly evident along its main street, which is surprisingly named after a Spanish battleground. The 1.8 kilometre stretch's great variety of well-kept businesses and gardens, the numerous wonderful locations to gather and dine, and the neighbourly spirit among merchants and residents are what make this spot so amazing.The Margin of Eras Gallery (the MOEG)
The Margin of Eras Gallery (MOEG) is a multidisciplinary arts venue devoted to displaying the creations of young, marginalised artists between the ages of 15 and 29. Systemic hurdles can prevent many relevant artists from contributing to our cultural story, and some of the most significant artwork is being produced by artists who endure social, cultural, and economic marginalisation. The MOEG is a place where people may interact with these artists and their work and where marginalised populations in the arts can be acknowledged and represented.Things to Do in Roncesvalles
Distance & Commute from Popular Locations
- Dundas West Station is 988 metres away, 14 min walk from Roncesvalles
- Roncesvalles is located 4.7 kilometres from Billy Bishop Toronto City (YTZ) Airport, the closest airport. Toronto (YYZ) (13.5 km), Hamilton (YHM) (66.3 km), Buffalo (BUF) (98.5 km), and Rochester (ROC) are more airports that are close by (155.4 km).
- Bloordale Village is one of the nearest Locality of Roncesvalles, Toronto, ON, Canada which is 2.0 km away.
Popular Markets in Roncesvalles
Pearson Fruit & Vegetables
Every day, fresh produce is available. Also offered is a huge selection of flowers, plants, and herbs. This is the neighbourhood shop that is immensely liked by residents.Sorauren Farmers' Market
Since 2008, the Sorauren Farmers' Market has been a warm gathering place that offers healthful, fresh food and opportunities for community interaction. In addition to giving marginalised workers job opportunities, we help regionally based sustainable farmers and producers. The main objectives are to foster relationships and conversations about healthy eating, sustainable farming, and gardening, as well as to put environmental protection policies into action.Roncesvalles Demographics
| Statistics | Southgate |
|---|---|
| Area Code | 948 |
| Population | 21526 |
| Population density (sq km) | 9,239 |
| Median age | 38.8 |
| Male/Female ratio | 1.1:1 |
| Married couples | 59% |
| Families w/ kids at home | 45% |
Things to Do in Roncesvalles with Kids & Pets
- Sorauren Park, however, is the go-to place in the area if you're seeking for a location with a more neighbourhood-focused vibe.
- Explore the beautiful outdoors, visit the sports area, or reserve the bake oven for a special event.
- You should also look into the park's calendar of neighbourhood activities, which includes a farmer's market and a regular outdoor movie series.
Average Cost of Living in Roncesvalles
| Index | Southgate (out of 100) |
|---|---|
| Cost of living | 129 |
| Goods & Services | 108 |
| Groceries | 100 |
| Health care | 103 |
| Housing | 175 |
| Transportation | 107 |
| Utilities | 130 |
Real Estate Housing Market of Roncesvalles
Roncesvalles - Location Map and Landmarks

- Commute
- Education
- Health Care
- Shopping & Recreational
- Nearby Cross Streets
- Bloor Go Station, Toronto 1.2 km
- Dundas West Subway, Toronto 1.23 km
- Bloor Train Station, Toronto 1.31 km
- Keele Subway, Toronto 1.36 km
- Lansdowne Subway, Toronto 1.51 km
- High Park Subway, Toronto 1.67 km
- Dufferin Subway, Toronto 1.88 km
- Runnymede Subway, Toronto 2.25 km
- Ossington Subway, Toronto 2.56 km
- Exhibition Go Station, Toronto 2.71 km
- St Vincent De Paul Catholic Elementary School, Toronto 0.11 km
- Fern Avenue Junior & Senior Public School, Toronto 0.27 km
- Garden Avenue Junior Public School, Toronto 0.35 km
- Howard Junior Public School, Toronto 0.52 km
- High Park Gardens Montessori, Toronto 0.72 km
- Ecole Secondaire Toronto Ouest, Toronto 0.92 km
- Saint Frere Andre Secondaire, Toronto 0.92 km
- Mary Mother Of God, Toronto 1.0 km
- Shirley Street Junior Public School, Toronto 1.02 km
- City View Alternative Senior School, Toronto 1.02 km
- St. Joseph's Health Centre, Toronto 0.69 km
- Centre for Addiction and Mental Health, Toronto 2.5 km
- 80 Workman Way, Toronto 2.56 km
- Runnymede Health Care Centre, Toronto 3.26 km
- University Health Network - Toronto Western, Toronto 3.59 km
- Toronto Western Hospital, Toronto 3.6 km
- Krembil Research Institute, Toronto 3.64 km
- Toronto Rehab Institute - Hillcrest Site, Toronto 4.43 km
- Mount Sinai Hospital, Toronto 4.88 km
- University Health Network - Toronto Rehabilitation Institute, Toronto 4.89 km
- Joe'S Variety & Gift Ctr, Toronto 0.11 km
- Sobey'S Express, Toronto 0.13 km
- Spring Creek Farm Produce, Toronto 0.17 km
- The Mercantile, Toronto 0.18 km
- Roncesvalles Fruit Village, Toronto 0.31 km
- Peter'S No Frills, Toronto 0.76 km
- Mike'S Nofrills Toronto, Toronto 0.8 km
- M.Y. Dollar Shop, Toronto 0.82 km
- Baraca Halal Foods, Toronto 0.84 km
- Loblaws, Toronto 0.95 km
- Howard Park Avenue and Roncesvalles Avenue, Toronto 0.6 km
- Dundas Street West and Sorauren Avenue, Toronto 0.62 km
- Howard Park Avenue and Dundas Street West, Toronto 0.65 km
- Parkside Drive and Howard Park Avenue, Toronto 0.75 km
FAQ
The average home sale price in the Roncesvalles area decreased 6% year-over-year to $1,089,428 for October 2022.
Your preferred Roncesvalles, Toronto, ON, houses for rent are only a few clicks away on Square Yards. Use the filtering options offered to acquire a list of properties that meet your requirements, whether you’re looking for single-family homes, mobile or recreational homes, or any other sorts of rental properties. There are 24 properties for rent on Square Yards in Roncesvalles, Toronto, ON, with monthly rates ranging from $2,800 to $5,750.
The nearby neighbourhoods in Roncesvalles include Bloor Street West, High Park, Queen Street West, and Lake Ontario, along with Lansdowne Avenue.
There are 25 homes for sale in Roncesvalles.
Properties usually remain on the market for an average period for 65 days.
As the liveability score of West Hill is 81/100 and the crime rate has decreased by 51%, the rank of this place has been higher among the Ontario neighbourhoods.


